DockerCompose 部署 Prometheus 与 Grafana
配置文件
docker-compose-monitor.yaml
1
2
3
4
5
6
7
8
9
10
11
12
13
14
15
16
17
18
19
20
21
22
23
24
25
26
27
28
29
30
31
32
33
34
35
36
37
38
39
40
41
42
43
44
45
46
47
48
49
50
51
52
| version: "3"
services:
prometheus:
image: prom/prometheus:latest
container_name: prometheus
restart: on-failure
ports:
- "9090:9090"
volumes:
- ./config/prometheus/prometheus.yml:/etc/prometheus/prometheus.yml
- ./config/prometheus/node_down.yml:/etc/prometheus/node_down.yml
- ./data/prometheus:/prometheus
networks:
- test-network
grafana:
image: grafana/grafana
container_name: grafana
restart: on-failure
ports:
- "3000:3000"
volumes:
- ./data/grafana:/var/lib/grafana
networks:
- test-network
node-exporter:
image: prom/node-exporter:latest
container_name: node-exporter
restart: on-failure
ports:
- "9100:9100"
networks:
- test-network
alertmanager:
image: prom/alertmanager:latest
container_name: alertmanager
restart: on-failure
ports:
- "9093:9093"
volumes:
- ./config/alertmanager/alertmanager.yml:/etc/alertmanager/alertmanager.yml
- ./data/alertmanager:/var/lib/alertmanager
networks:
- test-network
networks:
test-network:
external: true
|
prometheus.yml
1
2
3
4
5
6
7
8
9
10
11
12
13
14
15
16
17
18
19
20
21
22
23
24
25
26
| global:
scrape_interval: 15s
evaluation_interval: 15s
alerting:
alertmanagers:
- static_configs:
- targets:
- alertmanager:9093
rule_files:
- "node_down.yml"
scrape_configs:
- job_name: 'prometheus'
static_configs:
- targets: [ 'prometheus:9090' ]
labels:
instance: prometheus
service: prometheus-service
- job_name: 'node-exporter'
static_configs:
- targets: [ 'node-exporter:9100' ]
labels:
instance: node-exporter
service: node-exporter-service
|
node_down.yml
1
2
3
4
5
6
7
8
9
10
11
| groups:
- name: node-down
rules:
- alert: node-down
expr: up{job="node-exporter"} == 0
for: 15s
labels:
severity: 1
team: node
annotations:
summary: "{{ $labels.instance }} 已停止运行超过 15s!"
|
执行命令 docker compose -f .\docker-compose-monitor.yaml up -d
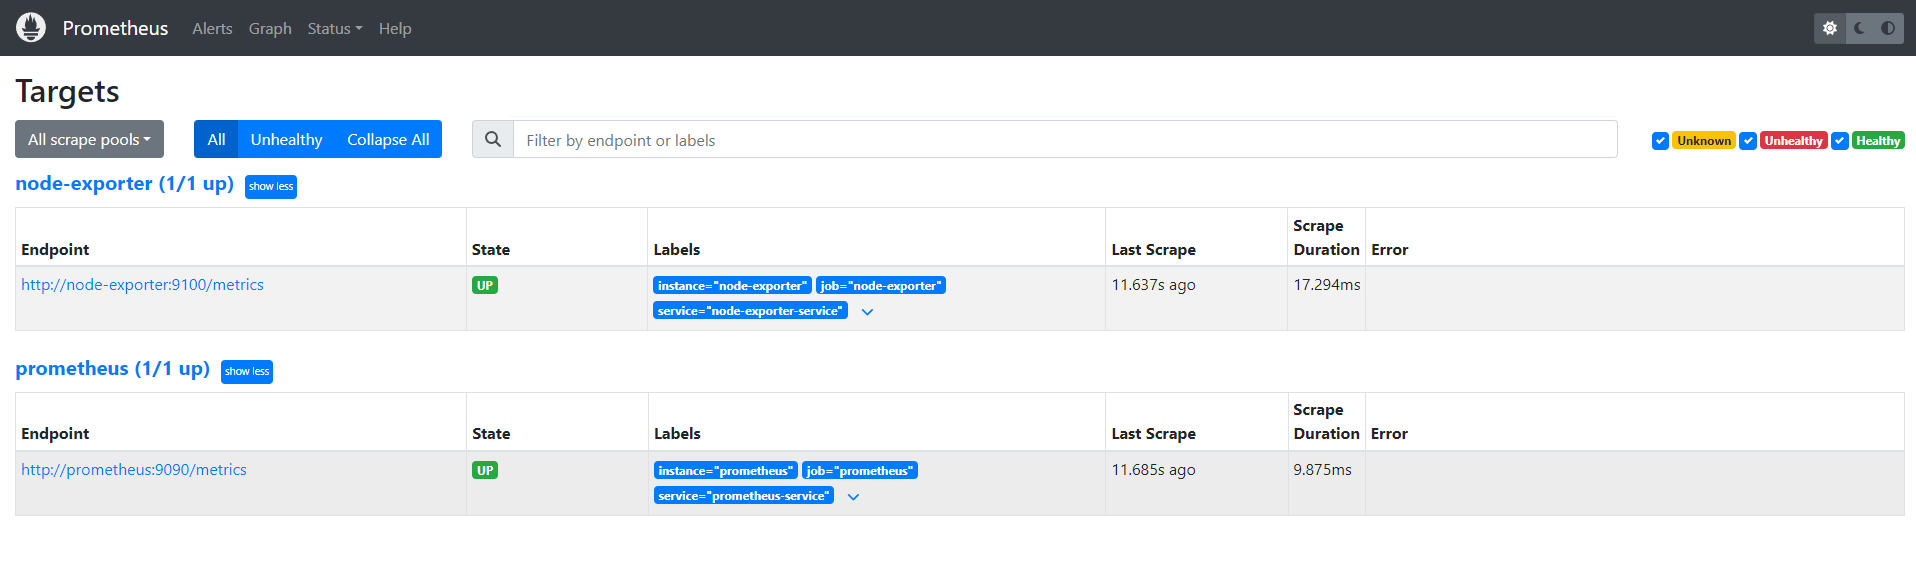
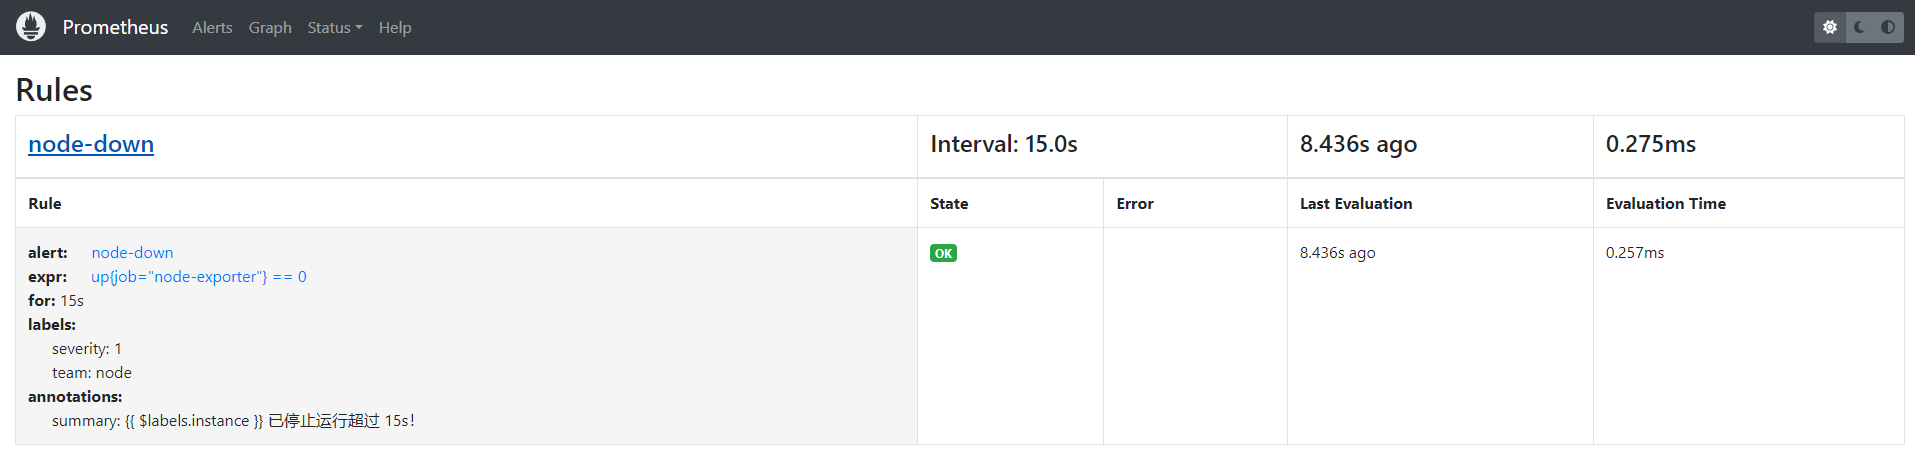
prometheus
验证
![image.png]()
![image.png]()
采集 Spring 应用数据
添加依赖
1
2
3
4
5
6
7
8
9
| <dependency>
<groupId>org.springframework.boot</groupId>
<artifactId>spring-boot-starter-actuator</artifactId>
</dependency>
<dependency>
<groupId>io.micrometer</groupId>
<artifactId>micrometer-registry-prometheus</artifactId>
</dependency>
|
开启 Actuator,打开 Endpoint
1
2
3
4
5
| management:
endpoints:
web:
exposure:
include: [ "prometheus","health" ]
|
验证 http://localhost:8080/actuator/prometheus
修改 prometheus.yml 配置
1
2
3
4
5
| scrape_configs:
- job_name: 'spring'
metrics_path: '/actuator/prometheus'
static_configs:
- targets: [ 'hostname:8010','hostname:8020' ]
|
grafana
访问 http://localhost:3000 ,用户名/密码:admin/admin
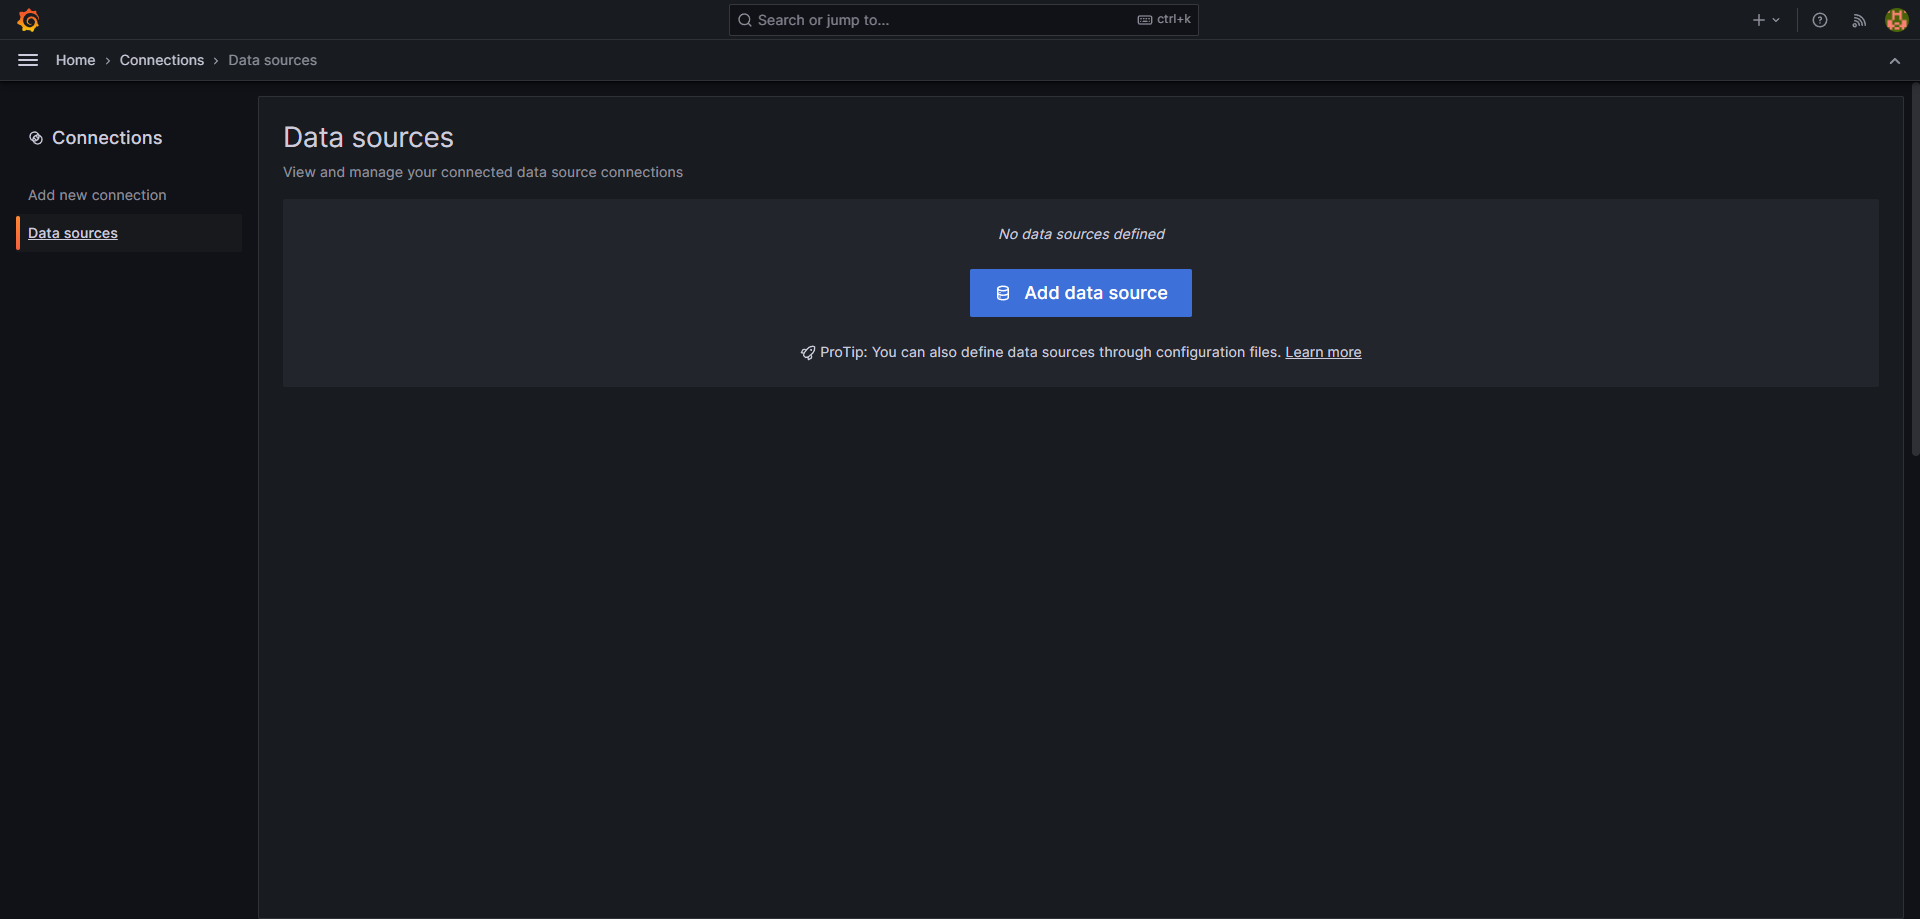
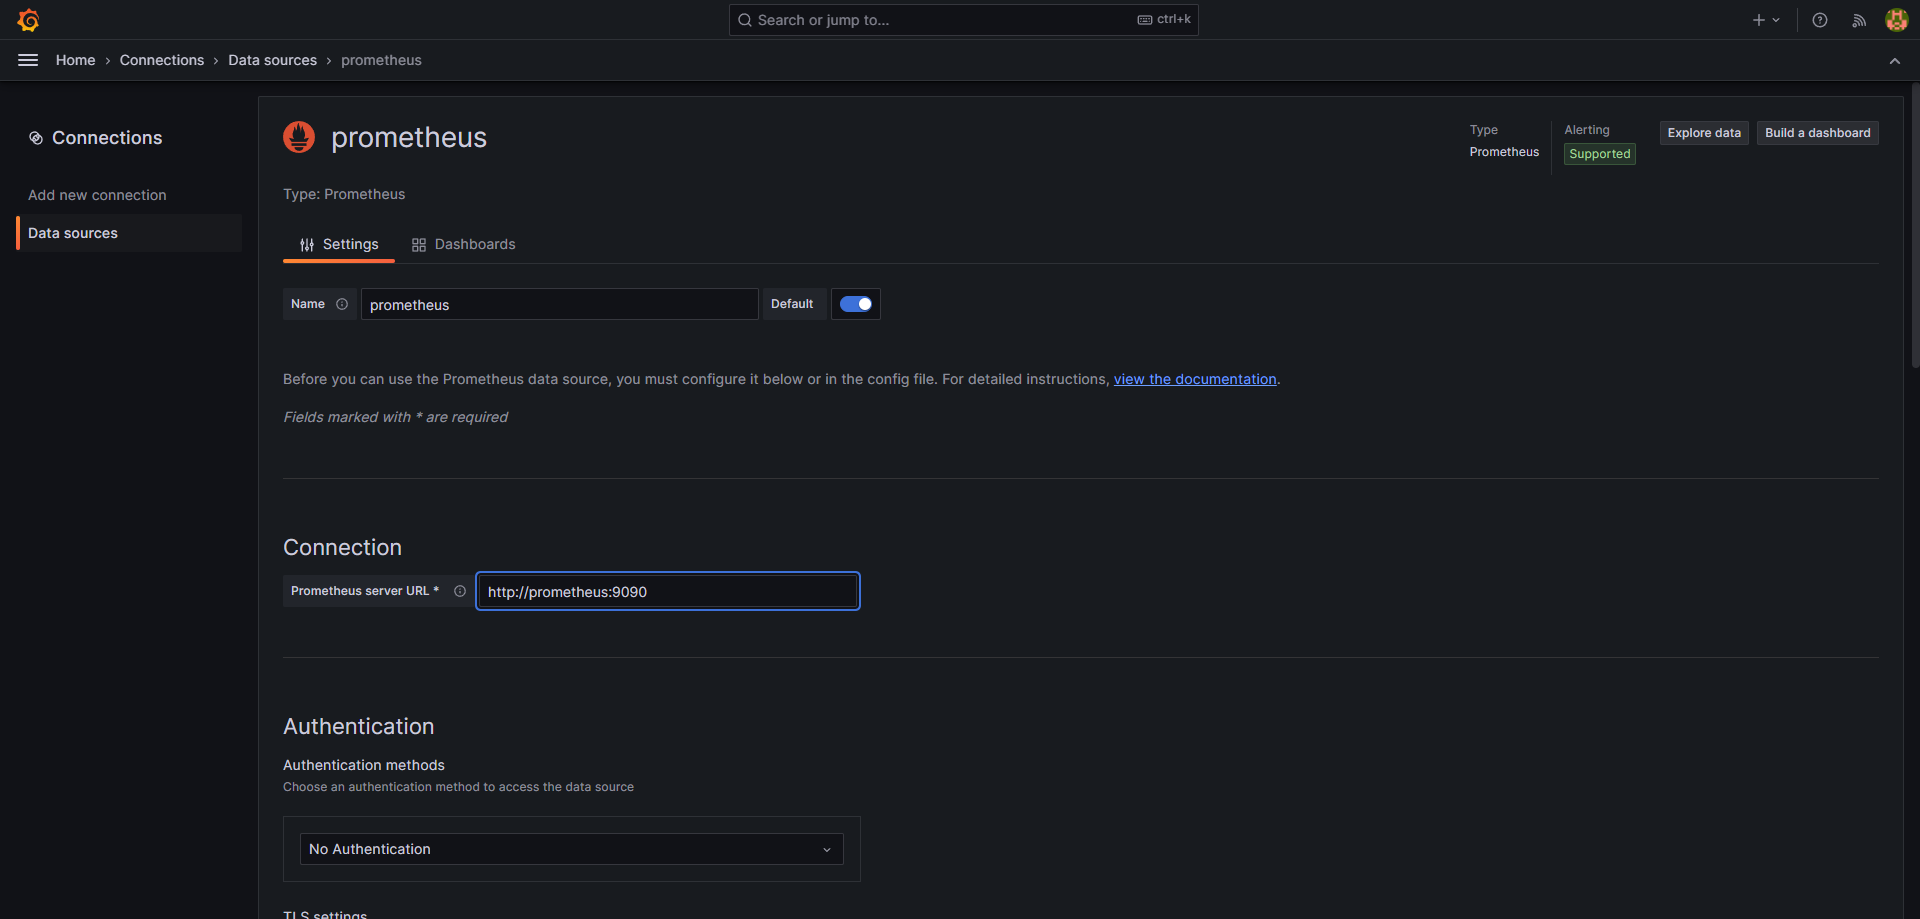
设置 DataSource
![image.png]()
![image.png]()
点击 Save & test
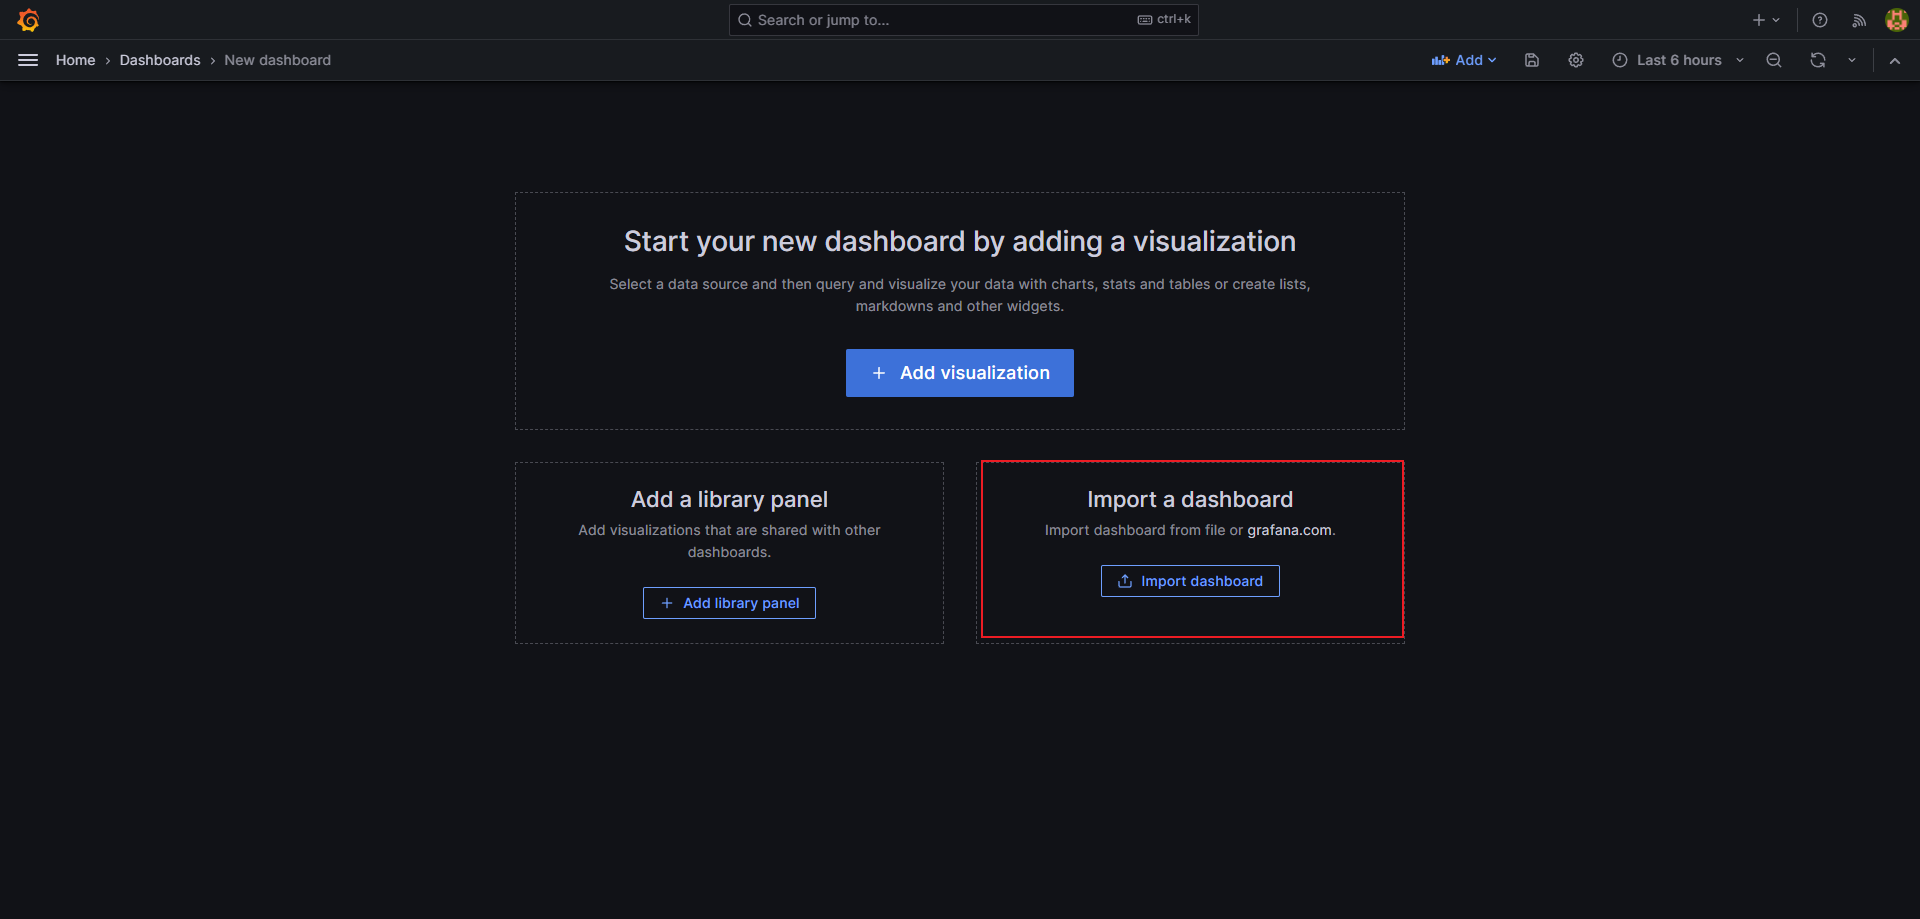
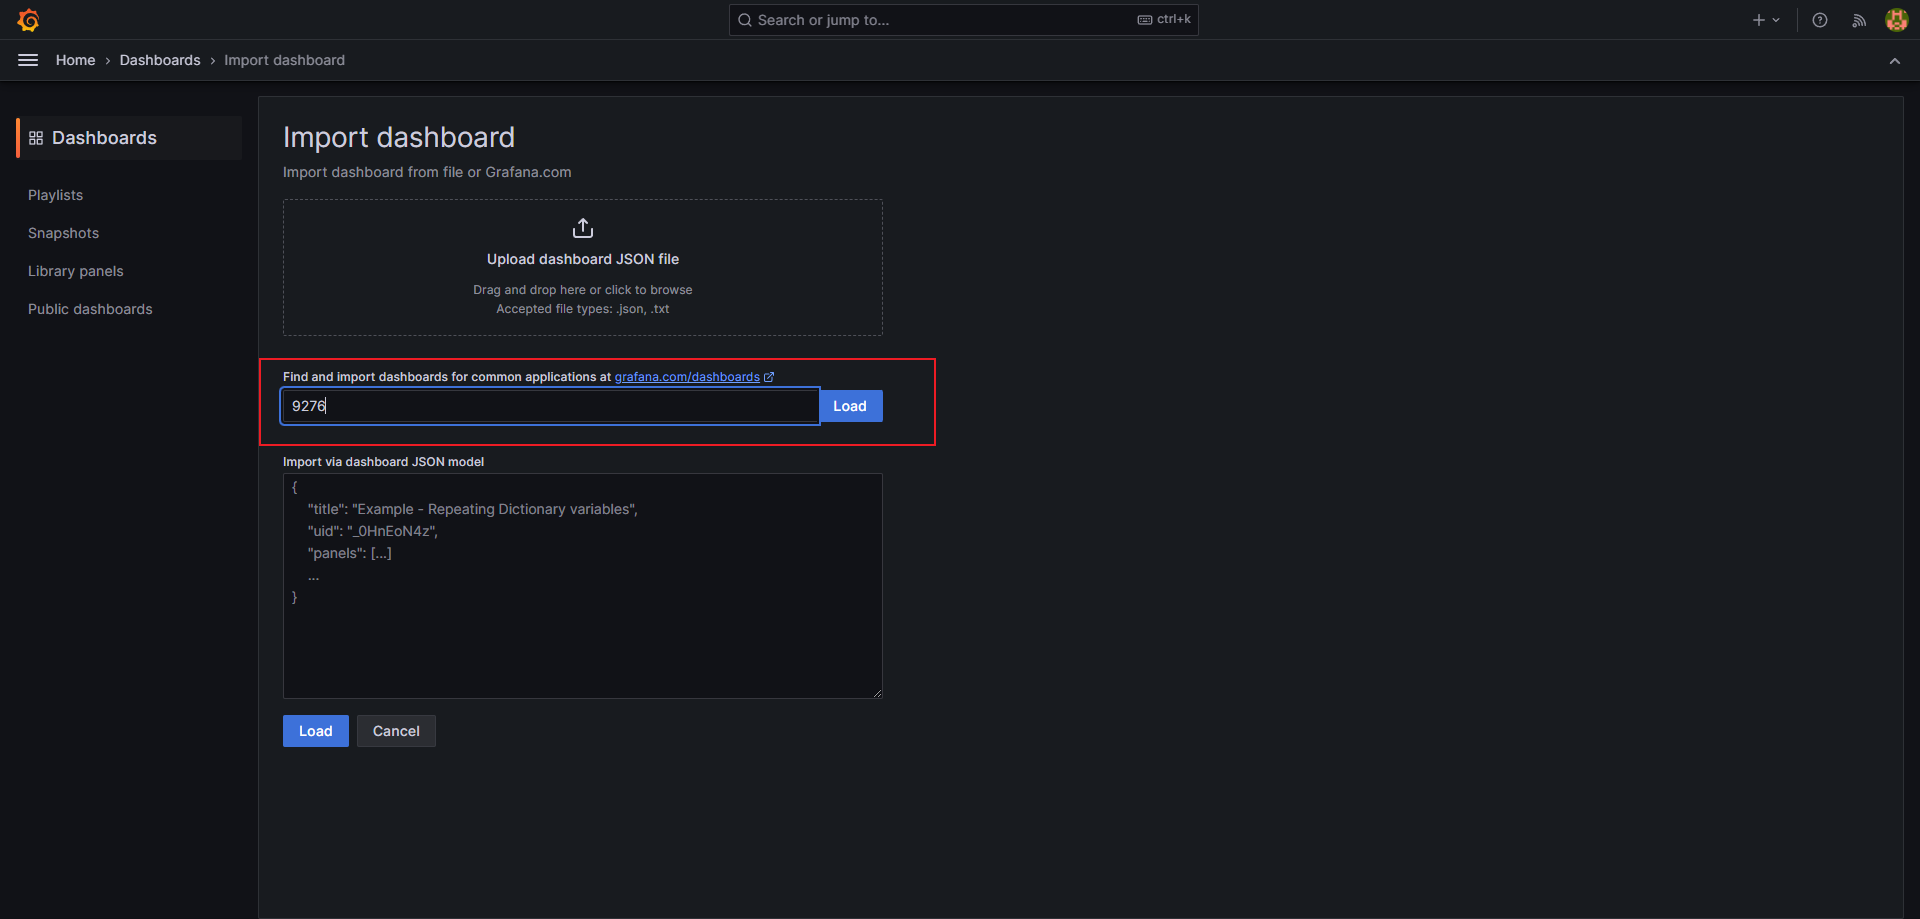
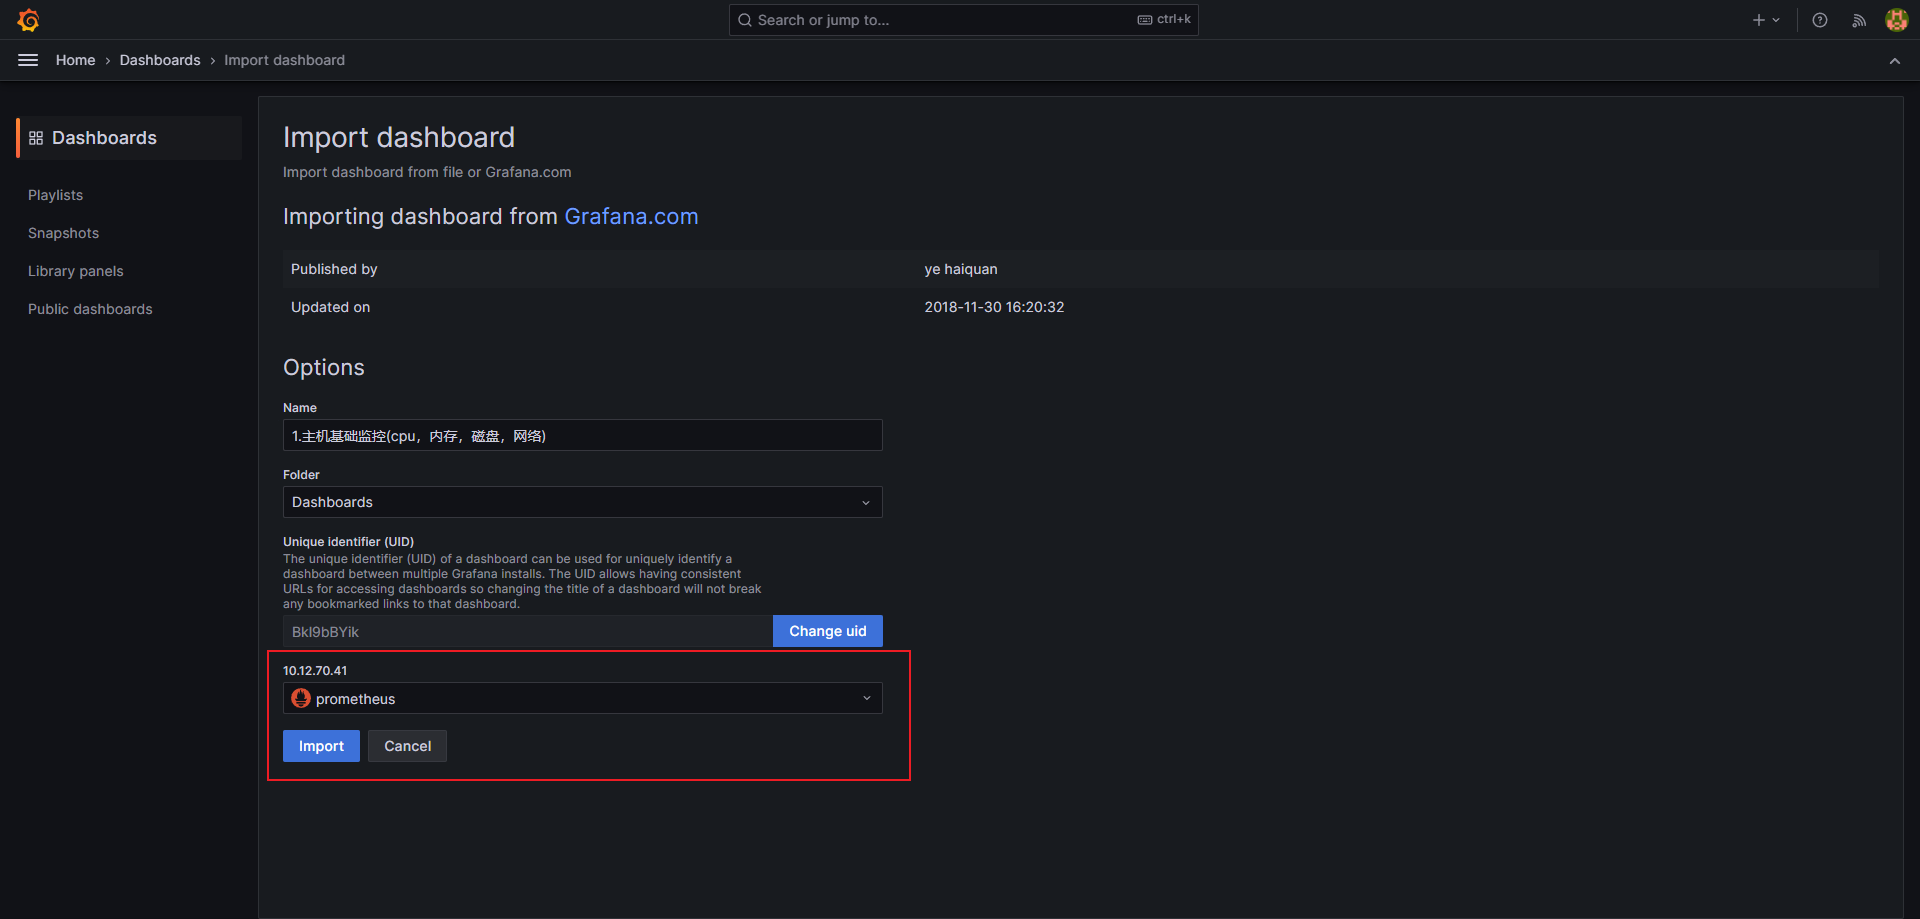
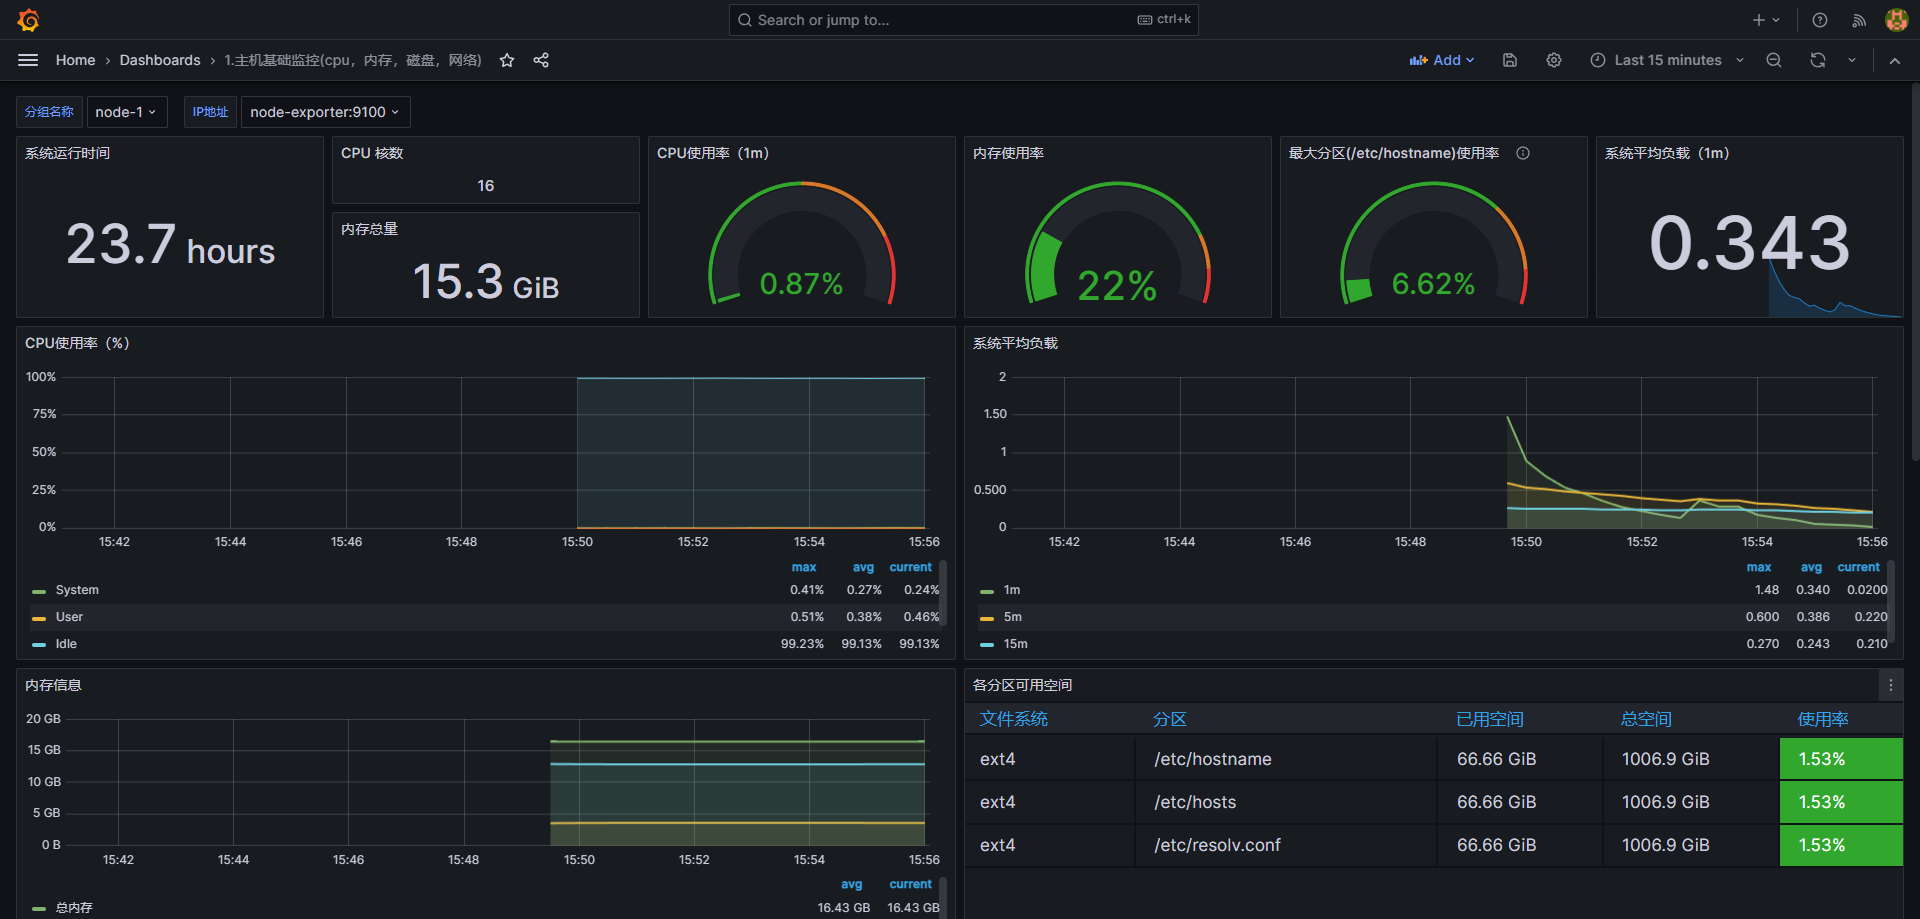
设置 Dashboard
![image.png]()
![image.png]()
![image.png]()
![image.png]()